Pourbaix diagram from literature values#
To calculate a Pourbaix diagram, we need to calculate the energy of the possible phases for different electrode potentials and pH. The phase with the lowest energy is the most stable. But what do we mean exactly by ‘energy’? In this part, you will learn what data to find in literature to make a Pourbaix diagram.
Chemical potential#
Let’s say the total internal energy of our material or molecule is \(U\). In electrochemistry, we usually have a fixed temperature \(T\) and pressure \(p\). We want to exclude the heat and volume work contributions from the environment, so we use the Gibbs free energy
with \(S\) the entropy and \(V\) the volume of the system. You can think of the Gibbs free energy as the ‘chemical energy’ in the system.
Equivalently, we can use the chemical potential \(\mu = G/N\), which is just the Gibbs energy per particle.
Formation energy#
In general, the chemical potential of a species \(i\) is
where \(\mu_i^0\) is the chemical potential at standard conditions and \(a_i\) is the activity. For dissolved species, the activity is the same as the concentration in M (assuming relatively low concentrations, which we always have in this case). We will assume the concentration of the dissolved ions to be \(10^{-6}\) M. For solids, \(a_i=1\).
The standard chemical potential is the same as the standard Gibbs free energy of formation per particle:
The formation energy of an element in its most stable state at standard conditions (gas for oxygen and hydrogen, solid for metals, etc.) is zero. (The elements are taken as a reference point!) For other species, values can be found online, like in the supplementary material of Wang et al. [2].
Task
Collect values of \(\mu\) for your material of interest (and remember that you need to cite the source in your report). The experimental value of water can be found in Persson et al. [3] (section II-C). Make sure all energies are in the same unit (preferably electronvolts, eV). It’s handy to use a similar format as shown below.
For now, you can ignore hydroxide ions or oxide ions, like \(\mathrm{Fe(OH)^+}\). (Update: Although I didn’t include these ions in my preparation, apparently the equations below also work for these ions. You can try it out.)
from scipy import constants as cst
import numpy as np

temperature = 298
concentration = 1e-6
loga = cst.k * temperature / cst.e * np.log(concentration)

species_data = {  # mu in eV, xyz according to (MxOyHz)
    "Fe":     {"mu": 0.0,            "x": 1, "y": 0, "z": 0, "charge": 0},
    "FeO":    {"mu": -2.553,         "x": 1, "y": 1, "z": 0, "charge": 0},
    "Fe3O4":  {"mu": -10.524,        "x": 3, "y": 4, "z": 0, "charge": 0},
    "Fe2O3":  {"mu": -7.693,         "x": 2, "y": 3, "z": 0, "charge": 0},
    "Fe2+":   {"mu": -0.817 + loga,  "x": 1, "y": 0, "z": 0, "charge": +2},
    "Fe3+":   {"mu": -0.048 + loga,  "x": 1, "y": 0, "z": 0, "charge": +3},
}
mu_h2o = -2.46
Reaction energies#
Now, we calculate the reaction energy of forming each phase from the solid metal phase and water.
Metal (hydr)oxides. A metal (hydr)oxide, for example, is formed as
so the reaction energy is
We finally divide everything by \(x\) so that all reactions are normalized to one metal unit.
Task
Write down the reaction for a specific metal (hydr)oxide of your choice and check that the general formula for \(\Delta \mu\) above is correct.
The electrode potential is defined as
with \(e\) the elementary charge.
Note
Actually, in the context of electrochemical interfaces, we should use the electrochemical potential \(\tilde{\mu}_i=\mu_i + z_i e\phi\) with \(z_i\) the charge and \(\phi\) the electric potential experienced by species \(i\). Then \(E = -\tilde{\mu}_e/e\). Here we just use the chemical potential for simplicity. Read more in the article Potentially Confusing: Potentials in Electrochemistry.
Task
Find a formula for the chemical potential of the solvated proton, \(\mathrm{H^+(aq)}\).
First, write down the equilibrium condition \(\sum_\mathrm{reactants} \mu_i = \sum_\mathrm{products} \mu_i\) for the hydrogen evolution reaction, (1).
Consider standard conditions to find \(\mu^0_\mathrm{H^+}\). Hints: what is the electrode potential of the SHE? What’s the chemical potential of hydrogen under standard conditions?
Using Eq. (3), find \(\mu_\mathrm{H^+}\).
Using \(\mathrm{pH}=-\log a_\mathrm{H^+}\), express \(\mu_\mathrm{H^+}\) in terms of pH.
Dissolution. A dissolution reaction is of the form
Task
Write the expression for \(\Delta \mu\) for a dissolution reaction. How is it related to standard redox potentials?
The species with the most negative \(\Delta \mu\) is the most likely to form spontaneously from a metal electrode under those conditions. In other words, the species with the most negative \(\Delta \mu\) is the most stable.
Calculating reaction energies#
Next, we need some Python code to automatically calculate \(\Delta \mu\) for all species under different conditions. Below, a function is provided. The input dictionary should provide \(\mu,x,y,z\) and the charge for each species.
Task
Finish the function mu_proton that calculates \(\mu_\mathrm{H^+}\) in eV.
import numpy as np

def mu_proton(acidity):
    ...

def calculate_delta_mu(
        potential: np.ndarray,
        acidity: np.ndarray,
        data: dict,
        mu_water: float,
    ):
    """
    Calculate the reaction energy (delta mu) normalized per metal atom.
    Parameters
    ----------
    potential : np.ndarray
        Electrode potential (V) vs. SHE.
    acidity : np.ndarray
        Acidity (pH).
    data : dict
        Dictionary with species properties (mu, x, y, z, charge).
    mu_water : float
        Standard chemical potential of water (eV).
    """
    num_protons = 2*data["y"] - data["z"]
    num_electrons = 2*data["y"] - data["z"] + data["charge"]
    products = data["mu"] + num_protons * mu_proton(acidity) - num_electrons * potential
    reactants = data["y"] * mu_water
    return (products - reactants) / data["x"]
Next, we need to define a grid of \(E\) and pH values for which to calculate \(\Delta \mu\), and execute the function calculate_delta_mu for each species.
potential_she_1d = np.linspace(-1.5, 2, 1000)
acidity_1d = np.linspace(-2, 16, 1000)
potential_she, acidity = np.meshgrid(potential_she_1d, acidity_1d)

# Create a new dictionary for the final delta_mu values
delta_mu = {}
for name, data in species_data.items():
    delta_mu[name] = calculate_delta_mu(potential_she, acidity, data, mu_h2o)
Finally, we can plot the Pourbaix diagram. You can use the function below, it will be handy throughout the practical.
import matplotlib.pyplot as plt
%matplotlib widget

def pourbaix(ax: plt.Axes, delta_mu: dict, acidity: np.ndarray, potential: np.ndarray):
    """
    Plot the Pourbaix diagram.
    Parameters
    ----------
    ax: Axes
        matplotlib Axes object on which to plot the diagram.
    delta_mu : dict
        Dictionary of the form {string: array} where the array contains the normalized
        delta mu for the species specified by the string.
    acidity : np.ndarray
        Acidity (pH).
    potential : np.ndarray
        Electrode potential (V) vs. SHE.
    """
    # Find minimum index at each (pH, E) coordinate
    min_indices = np.argmin(np.stack(list(delta_mu.values())), axis=0)

    # Make contour plot with black lines
    ax.contourf(acidity, potential, min_indices, cmap="Set2")
    ax.contour(acidity, potential, min_indices, colors="black", linewidths=1)

    # Set axis labels
    ax.set_xlabel(f'pH at {temperature} K')
    ax.set_ylabel(f'$E$ vs. SHE (V)')

    # Text labels
    for i, name in enumerate(delta_mu):
        if np.sum(min_indices == i) > 0:
            x_coord = np.mean(acidity[min_indices == i])
            y_coord = np.mean(potential_she[min_indices == i])
            ax.text(x_coord, y_coord, name, verticalalignment='center', horizontalalignment='center')

fig = plt.figure(figsize=(6, 4))
ax = fig.add_subplot()
pourbaix(ax, delta_mu, acidity, potential_she)
fig.tight_layout()
You should get an output like:
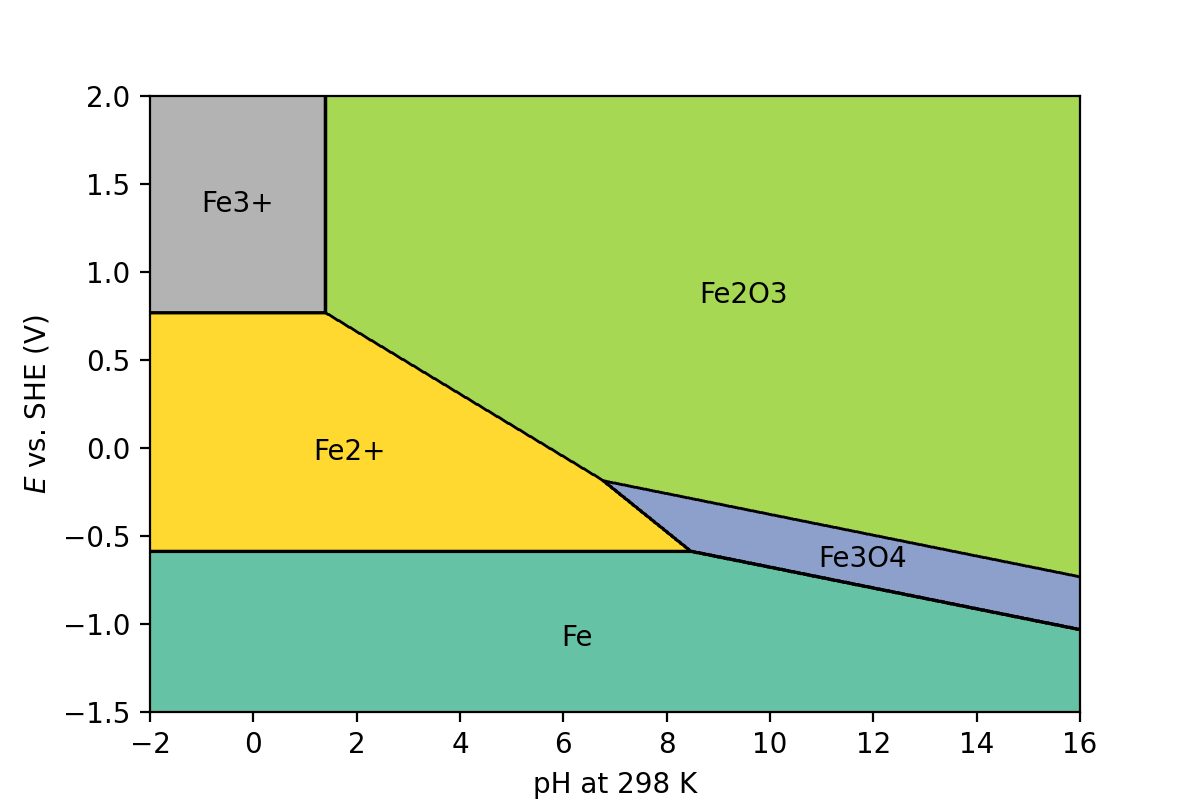
Fig. 2 Pourbaix diagram of iron plotted using experimental values from Wang et al. [2] and Persson et al. [3].#
Task
Compare your Pourbaix diagram to one from literature, like in Wang et al. [2].
Optional task
Add lines for the water stability window to the Pourbaix diagram. The lines satisfy \(\Delta \mu = 0\) for the hydrogen and oxygen evolution reactions.