Metals#
Most electrodes are made of metal. The electrodes in the fuel cell of a hydrogen car are made of platinum, for example. Here we calculate the binding energy of oxygen to metal electrodes. Our objective is to find out how reliable the simulation settings of Nørskov et al. [1] are.
Periodic boundary conditions#
First, let’s consider how to calculate the ground-state energy of a metal system.
The metal electrodes in experiments are several millimeters or centimeters big. An atom is less than a nanometer wide. Calculating the density of electrons for the millions of atoms in an electrode obviously takes too long on a computer. Luckily, metal is organized in a lattice, and looks similar everywhere.
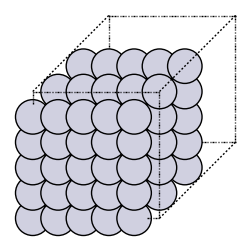
For this reason, one uses periodic boundary conditions: you model only a few atoms, called a supercell, and repeat the cell in each direction. This means that electrons on the right of the cell interact with electrons on the left of the next cell. In the picture below, you see such a supercell.
Show code cell source
from ase.build import bulk
from ase.visualize.plot import plot_atoms
import matplotlib.pyplot as plt

metal = bulk('Pt', crystalstructure='fcc', a=4.00)

fig = plt.figure(figsize=(3, 3))
ax = fig.add_subplot()
plot_atoms(metal.repeat((5, 5, 3)), ax)
plt.axis('off')
plt.show()

Density functional theory for periodic systems#
The content of this section is inspired by the article of Bernd Meyer in “Computational Nanoscience: Do It Yourself” of the FZ Jülich (p. 71), and the Open Solid State Notes of Akhmerov and Van der Sar (TU Delft).
Our goal is now to solve the Kohn-Sham equations for the orbitals \(\psi_i\) and their energies \(\varepsilon_i\) to obtain the ground state energy of a metal. It turns out that it is very efficient to make use of the periodicity of the simulation cell.
With the technique of Fourier series, it is possible to write any periodic function as a sum of waves with different frequencies. (The Fourier series technique is very similar to the Fourier transform.) For example, we can write the electric potential due to the charged metal nuclei as a Fourier series. Waves are written as complex exponentials \(e^{i ...}\).
In periodic systems, electron wavefunctions can also be written as waves. This fact is stated by Bloch’s theorem:
where \(\mathbf{k}\) is a three-dimensional wave vector \(\mathbf{k}=(k_x, k_y, k_z)\), that represents the direction in which the wave travels.
The function \(u_\mathbf{k}(\mathbf{r})\) is a function with the same periodicity as the nuclei in the metal lattice. Because it is a periodic function, we can write it as a Fourier series:
where \(c\) are coefficients.
Each wave \(\psi_\mathbf{k}\) is associated with an energy. A plot of the energy for each \(\mathbf{k}\) is called the band structure. The number of bands is related to the number of electrons per atom.

Fig. 3 Bandstructure of a platinum fcc(111) surface#
To calculate the total energy, we sum up all occupied bands over \(\mathbf{k}\). In the computer, the band structure is approximated by calculating the energies for a certain number of equally spaced \(\mathbf{k}\)-points. Calculating these energies takes time. For faster calculations, we can choose less \(\mathbf{k}\)-points, but we lose resolution in the band structure.
The frequencies \(\mathbf{k}\) are thus related to electron energies. The frequencies \(\mathbf{G}\) also have a meaning. Each \(\mathbf{G}\) corresponds to a term in the Fourier series of \(u_\mathbf{k}\). The more \(\mathbf{G}\)’s we include, the more accurately we can describe \(u_\mathbf{k}\), which is part of the electron wavefunctions. However, calculating more terms of the sum again takes time. We therefore only include \(\mathbf{G}\) up to some chosen value \(|\mathbf{G}|_\mathrm{cut}\). It is usually described as a ‘cutoff energy’:
Near a nucleus, the electron wave function changes very fast. Describing such fast changes requires a high \(E_\mathrm{cut}\). To speed up calculations, people have defined pseudopotentials. Pseudopotentials include the charge of the nucleus as well as the core electrons, which do not participate in chemical bonds. Pseudopotentials make the wave function smooth, so that we do not need a high \(E_\mathrm{cut}\).

Fig. 4 Pseudopotential and the corresponding pseudo-wavefunction (both red) comapred to the real potential and real wavefunction.#
Task 1: bulk metal#
Let’s get started with simulations. We’ll use the software VASP (Vienna Ab-initio Simulation Package), which runs on the computation cluster of the university. We will write several files that contain the simulation settings (input files). You can then upload them to the following website:
VASP will then do the calculation for you.
The first file we need is the INCAR file. Make an empty file and name it INCAR (not INCAR.txt, remove the extension). Enter the following contents:
The first line can be used for a comment. For example: "Bulk fcc metal"
ENCUT = 300
ISMEAR = 0
SIGMA = 0.05
EDIFF = 1e-6
GGA = RP
These are different settings for the algorithm that solves the Kohn-Sham equations. ENCUT specifies \(E_\mathrm{cut}\) which was introduced earlier on this page. EDIFF is the convergence criterion for the self-consistent solving cycles. If the energy of subsequent solutions changes by less than EDIFF, the algorithm stops and returns the final result. ISMEAR and SIGMA spread out the occupation of bands by electrons; this helps convergence. GGA sets the exchange-correlation functional to the RPBE functional.
Next, we need to specify the simulation cell. This is done by making a file POSCAR with the following contents:
Bulk fcc gold
 4.20
     0.5 0.5 0.0
     0.0 0.5 0.5
     0.5 0.0 0.5
 Au
   1
Cartesian
  0 0 0
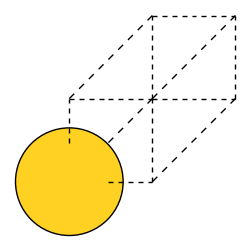
The first line is a comment. The next line is a scaling factor for the whole cell. The three lines below are normalized vectors of the cell. Here, I chose a cell that contains only one atom, the ‘primitive unit cell’. It looks like this:
Show code cell source
from ase.build import bulk
from ase.visualize.plot import plot_atoms
import matplotlib.pyplot as plt

metal = bulk('Au', crystalstructure='fcc', a=4.20)

fig = plt.figure(figsize=(3, 3))
ax = fig.add_subplot()
plot_atoms(metal, ax)
plt.axis('off')
plt.show()

Next, the POSCAR describes how many atoms there are of each type (here: Au, 1). The last lines of the POSCAR file set a shift of the atom in the cell. We don’t need to shift it, so we set it to zero.
Next, we need a KPOINTS file. We cannot calculate all k-points in the bandstructure, so we approximate it by a grid with a number of points. Here’s a possible k-points file:
Bulk fcc gold
0
Gamma
16 16 16
0 0 0
You can use the documentation on the VASP wiki to understand the different lines.
Lastly, we need a POTCAR file, that contains the pseudopotential that VASP will use. These you will get from the supervisor.
In the output repository, find the
OSZICARfile. Find the self-consistent field cycles and the final energyE0.Also find the
OUTCARfile. Find the energies calculated for each k-point.
(You don’t need to save anything here.)
Task 2: oxygen molecule#
A bulk metal is periodic, but an oxygen molecule is not. However, we can still simulate an oxygen molecule by making a large enough simulation cell, so that the molecule in one cell does not interact with the molecule in the next cell. Let’s do such a simulation.
INCAR:
Oxygen molecule
ENCUT = 400
ISMEAR = 0
SIGMA = 0.05
EDIFF = 1e-06
GGA = RP

IBRION = 2
EDIFFG = -1e-2
ISIF = 2
NSW = 100

ISPIN = 2
The first group of tags is the same as before. We just need a larger ENCUT to describe oxygen. The second group is related to geometry relaxation: IBRION = 2 specifies that we optimize (relax) the positions of the atoms until the forces on them are below EDIFFG = -1e-2, in eV/Å (1 Å, Ångstrom, is 0.1 nm). The last line indicates that we take into account spin. This is because the ground state of the oxygen molecule has two unpaired electrons.
POSCAR:
Oxygen molecule
 1
    10    0    0
     0   10    0
     0    0   10
 O
   2
Cartesian
  0  0  0
  0  0  1.5
Now we placed two oxygen atoms a distance of 1.5 Å apart.
KPOINTS:
Oxygen molecule
0
Gamma
1 1 1
0 0 0
It turns out that the band structure consists of a bunch of flat lines, so we only need one k-point to describe it. As a rule of thumb: if we don’t need the periodicity to describe the whole system, one k-point is sufficient.
Ask the supervisor for the oxygen POTCAR, submit the calculation, and find out:
the final bond length in Å, using the
CONTCARfile. Look for (a reliable source of) the bond length of oxygen on the internet. Does it agree with the calculation?the final electronic energy
E0, using theOSZICARfile
Task 3: empty slab#
We will model an electrode as a slab of a few atoms thick. Nørskov et al. [1] use a thickness of three atoms, for example. Writing POSCAR files by hand gets a bit annoying, so let’s use the Python module ASE. You can build and visualize a simple Pt slab as follows:
from ase.build import fcc111
from ase.visualize import view

slab = fcc111("Pt", size=(2, 2, 3), vacuum=7.0, a=4.00)
view(slab)
Lattice constants:
Material |
XC functional |
\(a\) / Å |
|---|---|---|
Pt |
RPBE |
4.00 |
Au |
RPBE |
4.20 |
Pt |
PBE |
3.98 |
Au |
PBE |
4.16 |
We also need to enable periodic boundary conditions, and fix the bottom two layers of the slab, so they don’t fly away (in reality, the rest of the metal would be holding them in place).
from ase.constraints import FixAtoms
slab.pbc = (True, True, True)
slab.set_constraint(FixAtoms(mask=[tag > 2 for tag in slab.get_tags()]))
You can export the slab as POSCAR using:
from ase.io import write
write("POSCAR", slab)
For your calculations, use the following INCAR file:
INCAR
Metal slab
ENCUT = 400
ISMEAR = 2
SIGMA = 0.05
EDIFF = 1e-6
GGA = RP

IBRION = 2
EDIFFG = -1.00e-02
ISIF = 2
NSW = 100
Write your own KPOINTS file using Nørskov et al. [1]. You can ignore that their grid is a ‘Monkhorst-Pack’ grid, and just change the number of k-points.
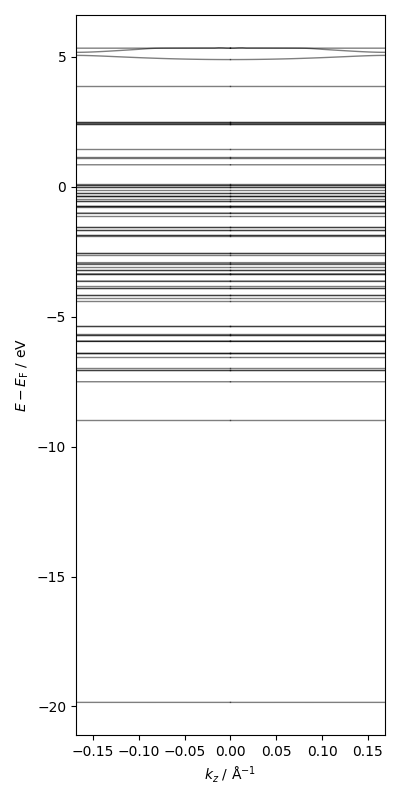
Using the bandstructure in the direction perpendicular to a slab, motivate the number of k-points in the z-direction.

Fig. 5 Bandstructure in the direction perpendicular to a platinum fcc(111) surface#
Ask the supervisor for the platinum POTCAR and use it to calculate the electronic energy of your empty slab.
Task 4: slab with adsorbate#
When programming, using a search engine and software documentation is very important.
Find a function to add an adsorbate to your surface. Write a new POSCAR with the adsorbate.
Ask for the new POTCAR and do the calculation with the same INCAR and KPOINTS as for the bare slab.
Thermal corrections at 298 K and 1 bar gas pressure in eV (energy) or eV/K (entropy):
\(U_\mathrm{trans}\) |
\(U_\mathrm{rot}\) |
\(U_\mathrm{vib}\) |
\(S_\mathrm{trans}\) |
\(S_\mathrm{rot}\) |
\(S_\mathrm{vib}\) |
\(PV=k_\mathrm{B}T\) |
|
|---|---|---|---|---|---|---|---|
\(\mathrm{O_2}\) |
0.0385 |
0.0257 |
0.0959 |
0.00158 |
0.000459 |
9.509E-5 (*) |
0.0257 |
\(\mathrm{Pt(111)-O}\) fcc |
0 |
0 |
0.100 |
0 |
0 |
0.000124 |
0 |
\(\mathrm{Au(111)-O}\) fcc |
0 |
0 |
0.0934 |
0 |
0 |
0.000159 |
0 |
\(\mathrm{Pt(111)-O}\) top |
0 |
0 |
0.0969 |
0 |
0 |
0.000144 |
0 |
\(\mathrm{Au(111)-O}\) top |
0 |
0 |
0.0398 |
0 |
0 |
2.248E-5 |
0 |
(*) This also contains the electronic entropy, because I didn’t have space for an extra column
Using the table above and your results, calculate the binding (Gibbs) energy.
Task 5: research project#
First, calculate the binding energy of O to both Pt and Au, and compare.
Then, choose a simulation setting of Nørskov et al. [1], change it and compare the binding energies of Pt and Au again. Examples of simulation settings are:
the number of k-points in the x- and y-directions
the number of layers
the adsorption site (
'fcc'or'ontop', see ASE documentation)the exchange-correlation functional (
GGA=RPfor RPBE orGGA=PEfor PBE)
More project ideas (if there is more time):
calculate the binding energies of the other intermediates (see also Kulkarni et al. [2]) with the computational hydrogen electrode approach.
calculate frequencies (spin-polarized?) and compare to Steininger et al. [3]
calculate binding energy referenced to a single atom; use spin-polarization; compare to Lynch and Hu [4]
References#
Jens Kehlet Nørskov, Jan Rossmeisl, Ashildur Logadottir, LRKJ Lindqvist, John R Kitchin, Thomas Bligaard, and Hannes Jonsson. Origin of the overpotential for oxygen reduction at a fuel-cell cathode. The Journal of Physical Chemistry B, 108(46):17886–17892, 2004. doi:10.1021/jp047349j.
Ambarish Kulkarni, Samira Siahrostami, Anjli Patel, and Jens K Nørskov. Understanding catalytic activity trends in the oxygen reduction reaction. Chemical reviews, 118(5):2302–2312, 2018. doi:10.1021/acs.chemrev.7b00488.
H Steininger, S Lehwald, and H Ibach. Adsorption of oxygen on pt (111). Surface Science, 123(1):1–17, 1982. doi:10.1016/0039-6028(82)90124-8.
M Lynch and P Hu. A density functional theory study of co and atomic oxygen chemisorption on pt (111). Surface Science, 458(1-3):1–14, 2000. doi:10.1016/S0039-6028(00)00456-8.