Figure guidelines#
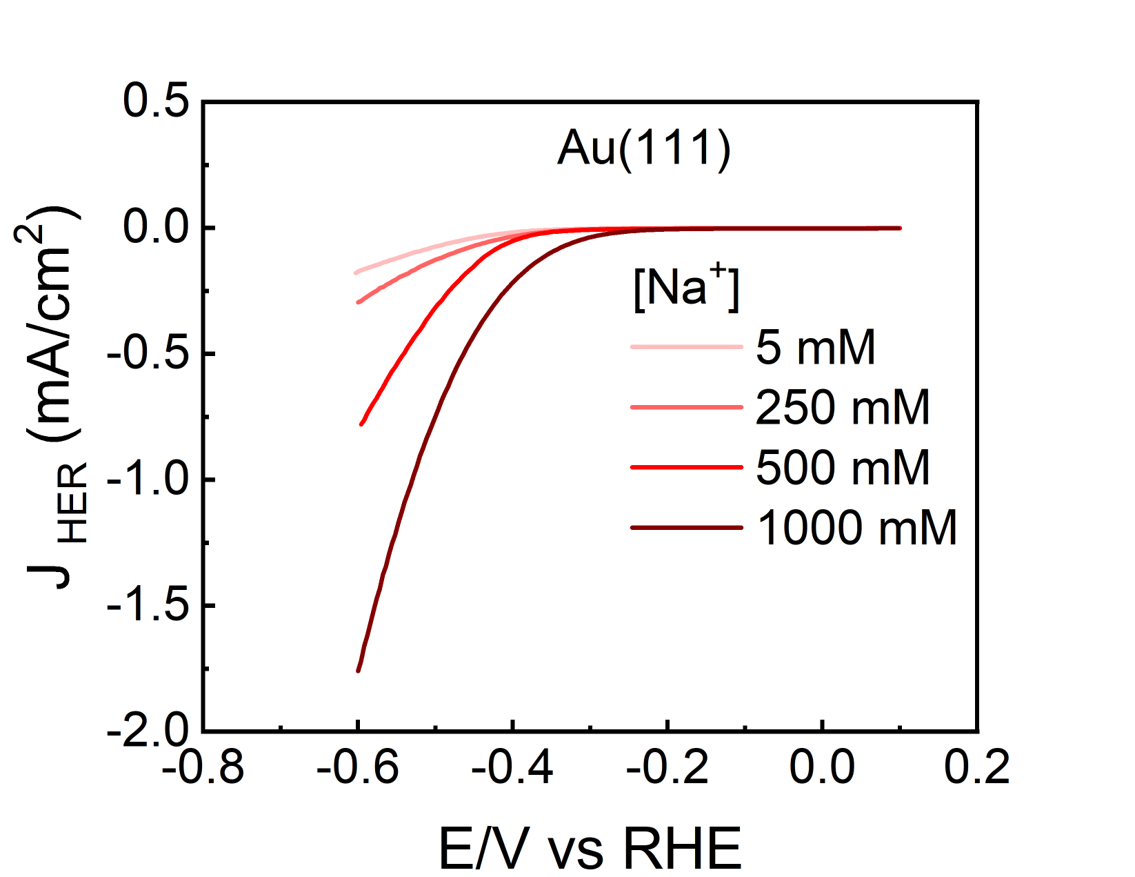
When making figures there are a few formatting guidelines you should adhere to in order to make them look nice and easy to read. These set of guidelines are also what we usually follow for scientific papers. Below is an example of a well formatted figure.

Fig. 10 Example hydrogen evolution on gold single crystal.#
Important points to note
Axis titles on both axes, which include the name of the quantity you are measuring and the unit, usually these should be abbreviations so the axis title doesn’t become too long
When plotting potentials, we always have to give which reference electrode we measured the potential against, in this course we used the reversible hydrogen electrode (RHE)
The labels on each axis should be easily readable numbers – this means that sometimes you have to convert the order of magnitude, for example instead of plotting currents in A, it is usually better to plot it in mA or μA – make sure you also change the unit in the axis label accordingly
There should be no gridlines, but there should be tick marks
There should be no axis title, instead include a figure caption where you write a concise description of what you are showing in the figure
If you are comparing multiple things in one figure, include a legend