By finding roots for the P- and N-states existence equations, we can now map out the parameter values for which there are certain solutions. The book also provides an analysis of the adbond character, i.e., for which parameters the electron localizes more on the adsorbate (anionic chemisorption) or more on the substrate (cationic chemisorption). The book finally derives the adsorption energy, which has some similar terms as the eventual one from the ANG model.
import matplotlib.pyplot as plt
import numpy as np
from scipy.optimize import root_scalar
plt.style.use('images/lucas.mplstyle')
# Parameters
ZA_VALS = np.linspace(-5, 5, 100) # z_a
ZS_VALS = np.linspace(-5, 5, 100) # z_s
# Define the two equations
def f1(u, a, s, b):
"""Existence of P-states"""
return (a + u + 1/u) * (s + u) - b
def f2(u, a, s, b):
"""Existence of N-states"""
return (a - u - 1/u) * (s - u) - b
def count_roots(a, s, b):
"""Count distinct real roots of both equations for given a, s."""
u_grid = np.logspace(0, 2, 100)
roots = []
for func in [f1, f2]:
fvals = func(u_grid, a, s, b)
for i in range(len(u_grid) - 1):
if np.isnan(fvals[i]) or np.isnan(fvals[i+1]):
continue
if fvals[i] * fvals[i+1] < 0:
try:
sol = root_scalar(func, args=(a, s, b),
bracket=[u_grid[i], u_grid[i+1]],
method='brentq')
if sol.converged:
u_root = sol.root
# avoid duplicates
if not any(abs(u_root - r) < 1e-4 for r in roots):
roots.append(u_root)
except Exception:
pass
return len(roots)
def compute_counts(eta_sq):
"""Return a matrix with the number of real roots for each
(z_a, z_s) pair at the supplied η²."""
counts = np.zeros((len(ZA_VALS), len(ZS_VALS)), dtype=int)
for i, a_val in enumerate(ZA_VALS):
for j, s_val in enumerate(ZS_VALS):
counts[i, j] = count_roots(a_val, s_val, eta_sq)
return counts
def plot_existence(eta_sq, figsize=(4, 3)):
"""Compute and plot the existence diagram for a given η².
Returns (fig, ax, counts) so that later cells can inspect
the data if required.
"""
counts = compute_counts(eta_sq)
fig = plt.figure(figsize=figsize)
ax = fig.add_subplot()
cmap = plt.get_cmap('coolwarm', 3)
im = ax.pcolormesh(ZA_VALS, ZS_VALS, counts.T, shading='auto', cmap=cmap)
ax.set_xlabel(r"$z_a$")
ax.set_ylabel(r"$z_s$")
ax.set_xlim([-5, 5])
ax.set_ylim([-5, 5])
ax.vlines([-2, 2], -10, 10, colors='k', linestyles='--', linewidth=1)
ax.hlines([-1, 1], xmin=-10, xmax=10, color='k', linestyles='--', linewidth=1)
cbar = fig.colorbar(im, ax=ax, ticks=[0, 1, 2])
cbar.set_label('Number of solutions')
fig.tight_layout()
return fig, ax, counts
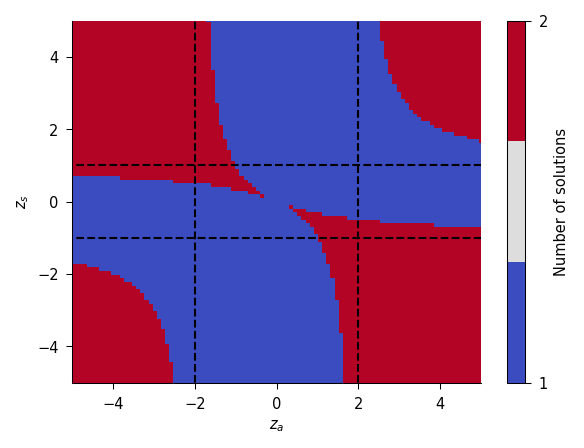
fig, _, _ = plot_existence(eta_sq=1)
plt.show()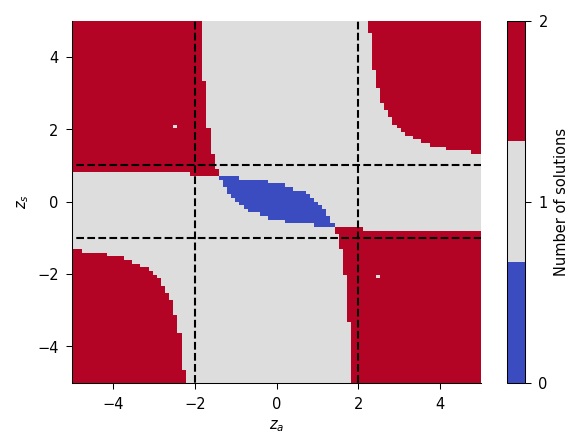
fig, _, _ = plot_existence(eta_sq=1e-2)
plt.show()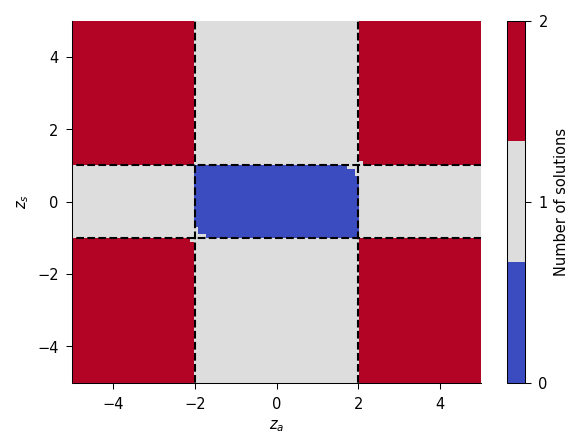
fig, _, _ = plot_existence(eta_sq=2)
plt.show()